
The Accounts · daily brief
27 May 2026
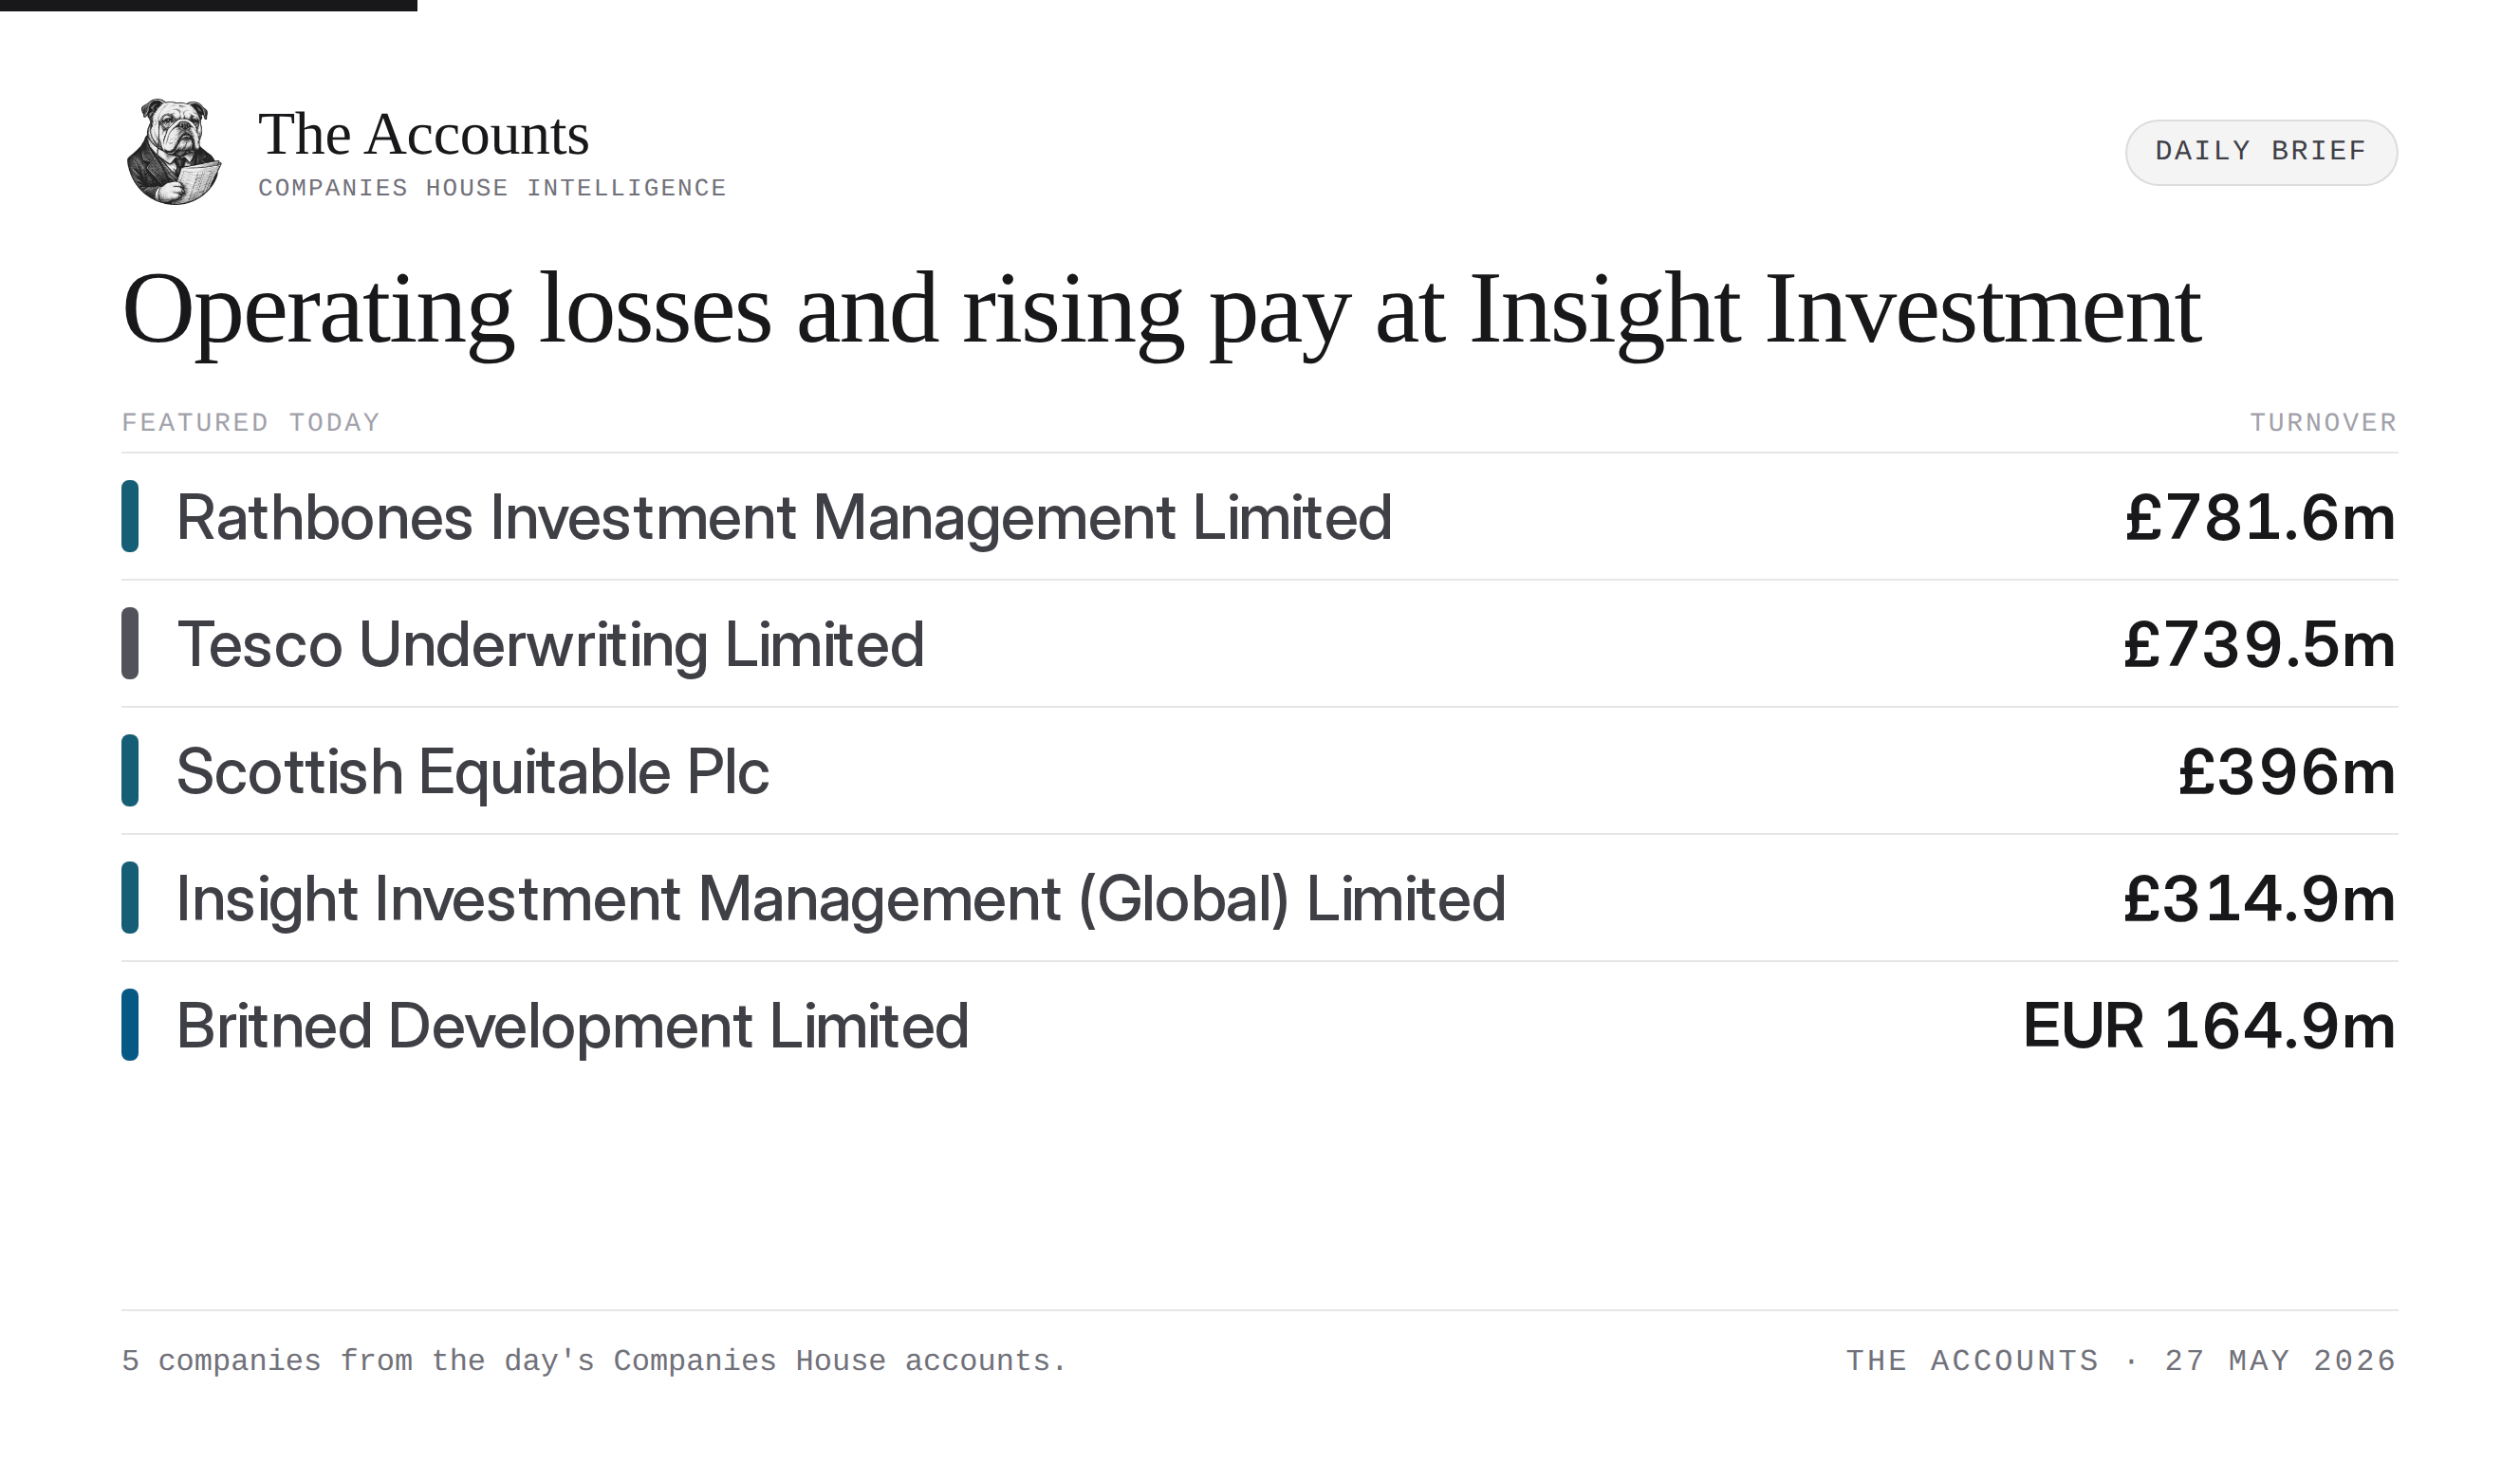
Operating losses and rising pay at Insight Investment
The takeaways
- Insight Investment swung to a £15.4m operating loss, while top director pay rose 47%
- Rathbones booked an 83% surge in turnover, with average headcount expanding by 700 staff
- BritNed saw a 23% drop in administrative costs alongside a 61% rise in pre-tax profit
Rathbones Investment Management Limited [1]
Significant growth
| Line | FY25 | FY24 | YoY |
|---|---|---|---|
| Profit & loss | |||
| Turnover | £781.6m | £425m | ▲ +84% |
| Operating profit | £111.5m | £21.2m | ▲ +427% |
| Profit before tax | £111.5m | £21.2m | ▲ +427% |
| Net profit | £81.1m | £16.4m | ▲ +396% |
| Cash & balance sheet | |||
| Cash | £1.5bn | £1.2bn | ▲ +29% |
| Net assets | £1.1bn | £405.2m | ▲ +183% |
| Dividends paid | −£69m | −£27m | ▼ −156% |
| People & pay | |||
| Avg. headcount | 2,769 | 2,054 | ▲ +35% |
| Staff cost | £339.8m | £209.5m | ▲ +62% |
| Director pay | £4.1m | £3.4m | ▲ +20% |
| Highest-paid director | £1.3m | £1.6m | ▼ −19% |
A record year for the wealth manager's operating subsidiary. Turnover surged 83% to £781.6m, as operating profit rose more than fivefold to £111.4m. That kind of expansion requires resourcing, and the period saw average headcount rise by over 700 to bring total staffing to 2,769.
Tesco Underwriting Limited [2]
Contracted margins
| Line | FY26 | FY25 | YoY |
|---|---|---|---|
| Profit & loss | |||
| Turnover | £739.5m | £653.4m | ▲ +13% |
| Finance costs | £12.8m | £10.5m | ▲ +22% |
| Profit before tax | £32.5m | £41.5m | ▼ −22% |
| Net profit | £24.5m | £31.5m | ▼ −22% |
| Cash & balance sheet | |||
| Cash | £156.9m | £87.1m | ▲ +80% |
| Dividends paid | −£15.8m | −£20m | ▲ +21% |
| People & pay | |||
| Avg. headcount | 442 | 390 | ▲ +13% |
| Highest-paid director | £190k | £560k | ▼ −66% |
The supermarket's insurance arm recorded higher turnover alongside a contracted margin. Turnover ticked up 13% to £739.5m, while pre-tax profit slid 21% to £32.5m. The final pre-tax figure was supported by a £40.3m finance income credit that partially offset the decline in operating performance.
Scottish Equitable Plc [3]
Profit slide
| Line | FY25 | FY24 | YoY |
|---|---|---|---|
| Profit & loss | |||
| Turnover | £396m | £363m | ▲ +9% |
| Finance costs | £49.7m | £50.5m | ▼ −2% |
| Profit before tax | £48.3m | £69.7m | ▼ −31% |
| Net profit | £16.9m | £57.5m | ▼ −71% |
| Cash & balance sheet | |||
| Cash | £55.4m | £55.4m | ▲ −0% |
| Dividends paid | −£155m | −£132.5m | ▼ −17% |
| People & pay | |||
| Director pay | £2.9bn | £2.8bn | ▲ +3% |
Top-line growth of 9% to £396m was accompanied by a 30% slide in pre-tax profit to £48.3m for the Aegon UK subsidiary. As is standard for a life insurer of this scale, the trading figures are dwarfed by the balance sheet, which generated £1.02bn in finance income to support the overall statutory position.
Insight Investment Management (Global) Limited [4]
Costs outpace sales
| Line | FY25 | FY24 | YoY |
|---|---|---|---|
| Profit & loss | |||
| Turnover | £314.9m | £332.8m | ▼ −5% |
| Gross profit | £284.1m | £303.9m | ▼ −7% |
| Admin expenses | £299.5m | £277.1m | ▲ +8% |
| Operating profit | −£15.4m | £26.8m | ▼ −157% |
| Finance costs | £468k | £1.9m | ▼ −75% |
| Profit before tax | −£5m | £38.3m | ▼ −113% |
| Net profit | −£5m | £28.8m | ▼ −118% |
| Cash & balance sheet | |||
| Cash | £52.8m | £52m | ▲ +1% |
| Net assets | £312.8m | £332.9m | ▼ −6% |
| Dividends paid | £15m | £33m | ▼ −55% |
| People & pay | |||
| Director pay | £10.4m | £8.9m | ▲ +16% |
| Highest-paid director | £4.5m | £3.1m | ▲ +47% |
A classic structural margin squeeze at BNY Mellon's asset management arm. Turnover dipped 5% to £314.9m while administrative expenses climbed 8%, moving the firm into a £15.4m operating loss. During the same period, the highest-paid director's remuneration package rose by 47% to reach £4.5m.
Britned Development Limited [5]
Highly profitable
| Line | FY25 | FY24 | YoY |
|---|---|---|---|
| Profit & loss | |||
| Turnover | EUR 164.9m | EUR 130.9m | ▲ +26% |
| Admin expenses | EUR 41.1m | EUR 53.4m | ▼ −23% |
| Finance costs | EUR 3.6m | EUR 2.7m | ▲ +33% |
| Profit before tax | EUR 121.4m | EUR 75.4m | ▲ +61% |
| Net profit | EUR 93.8m | EUR 55.4m | ▲ +69% |
| Cash & balance sheet | |||
| Cash | EUR 42m | EUR 76.4m | ▼ −45% |
| Net assets | EUR 375.8m | EUR 407.1m | ▼ −8% |
| Dividends paid | −EUR 125.1m | −EUR 62.6m | ▼ −100% |
The cross-channel power cable recorded a highly profitable year. Revenues climbed 26% to €164.9m as administrative costs simultaneously fell 23%, creating a jaws effect that saw pre-tax profit rise 61% to €121.4m. The period also saw an increase in distributions, with the dividend payout doubling to €125.1m.
A reminder that operating losses and rising board pay can sometimes run in parallel.
Sources
- Rathbones Investment Management Limited
- Tesco Underwriting Limited
- Scottish Equitable Plc
- Insight Investment Management (Global) Limited
- Britned Development Limited