
The Accounts · daily brief
1 June 2026
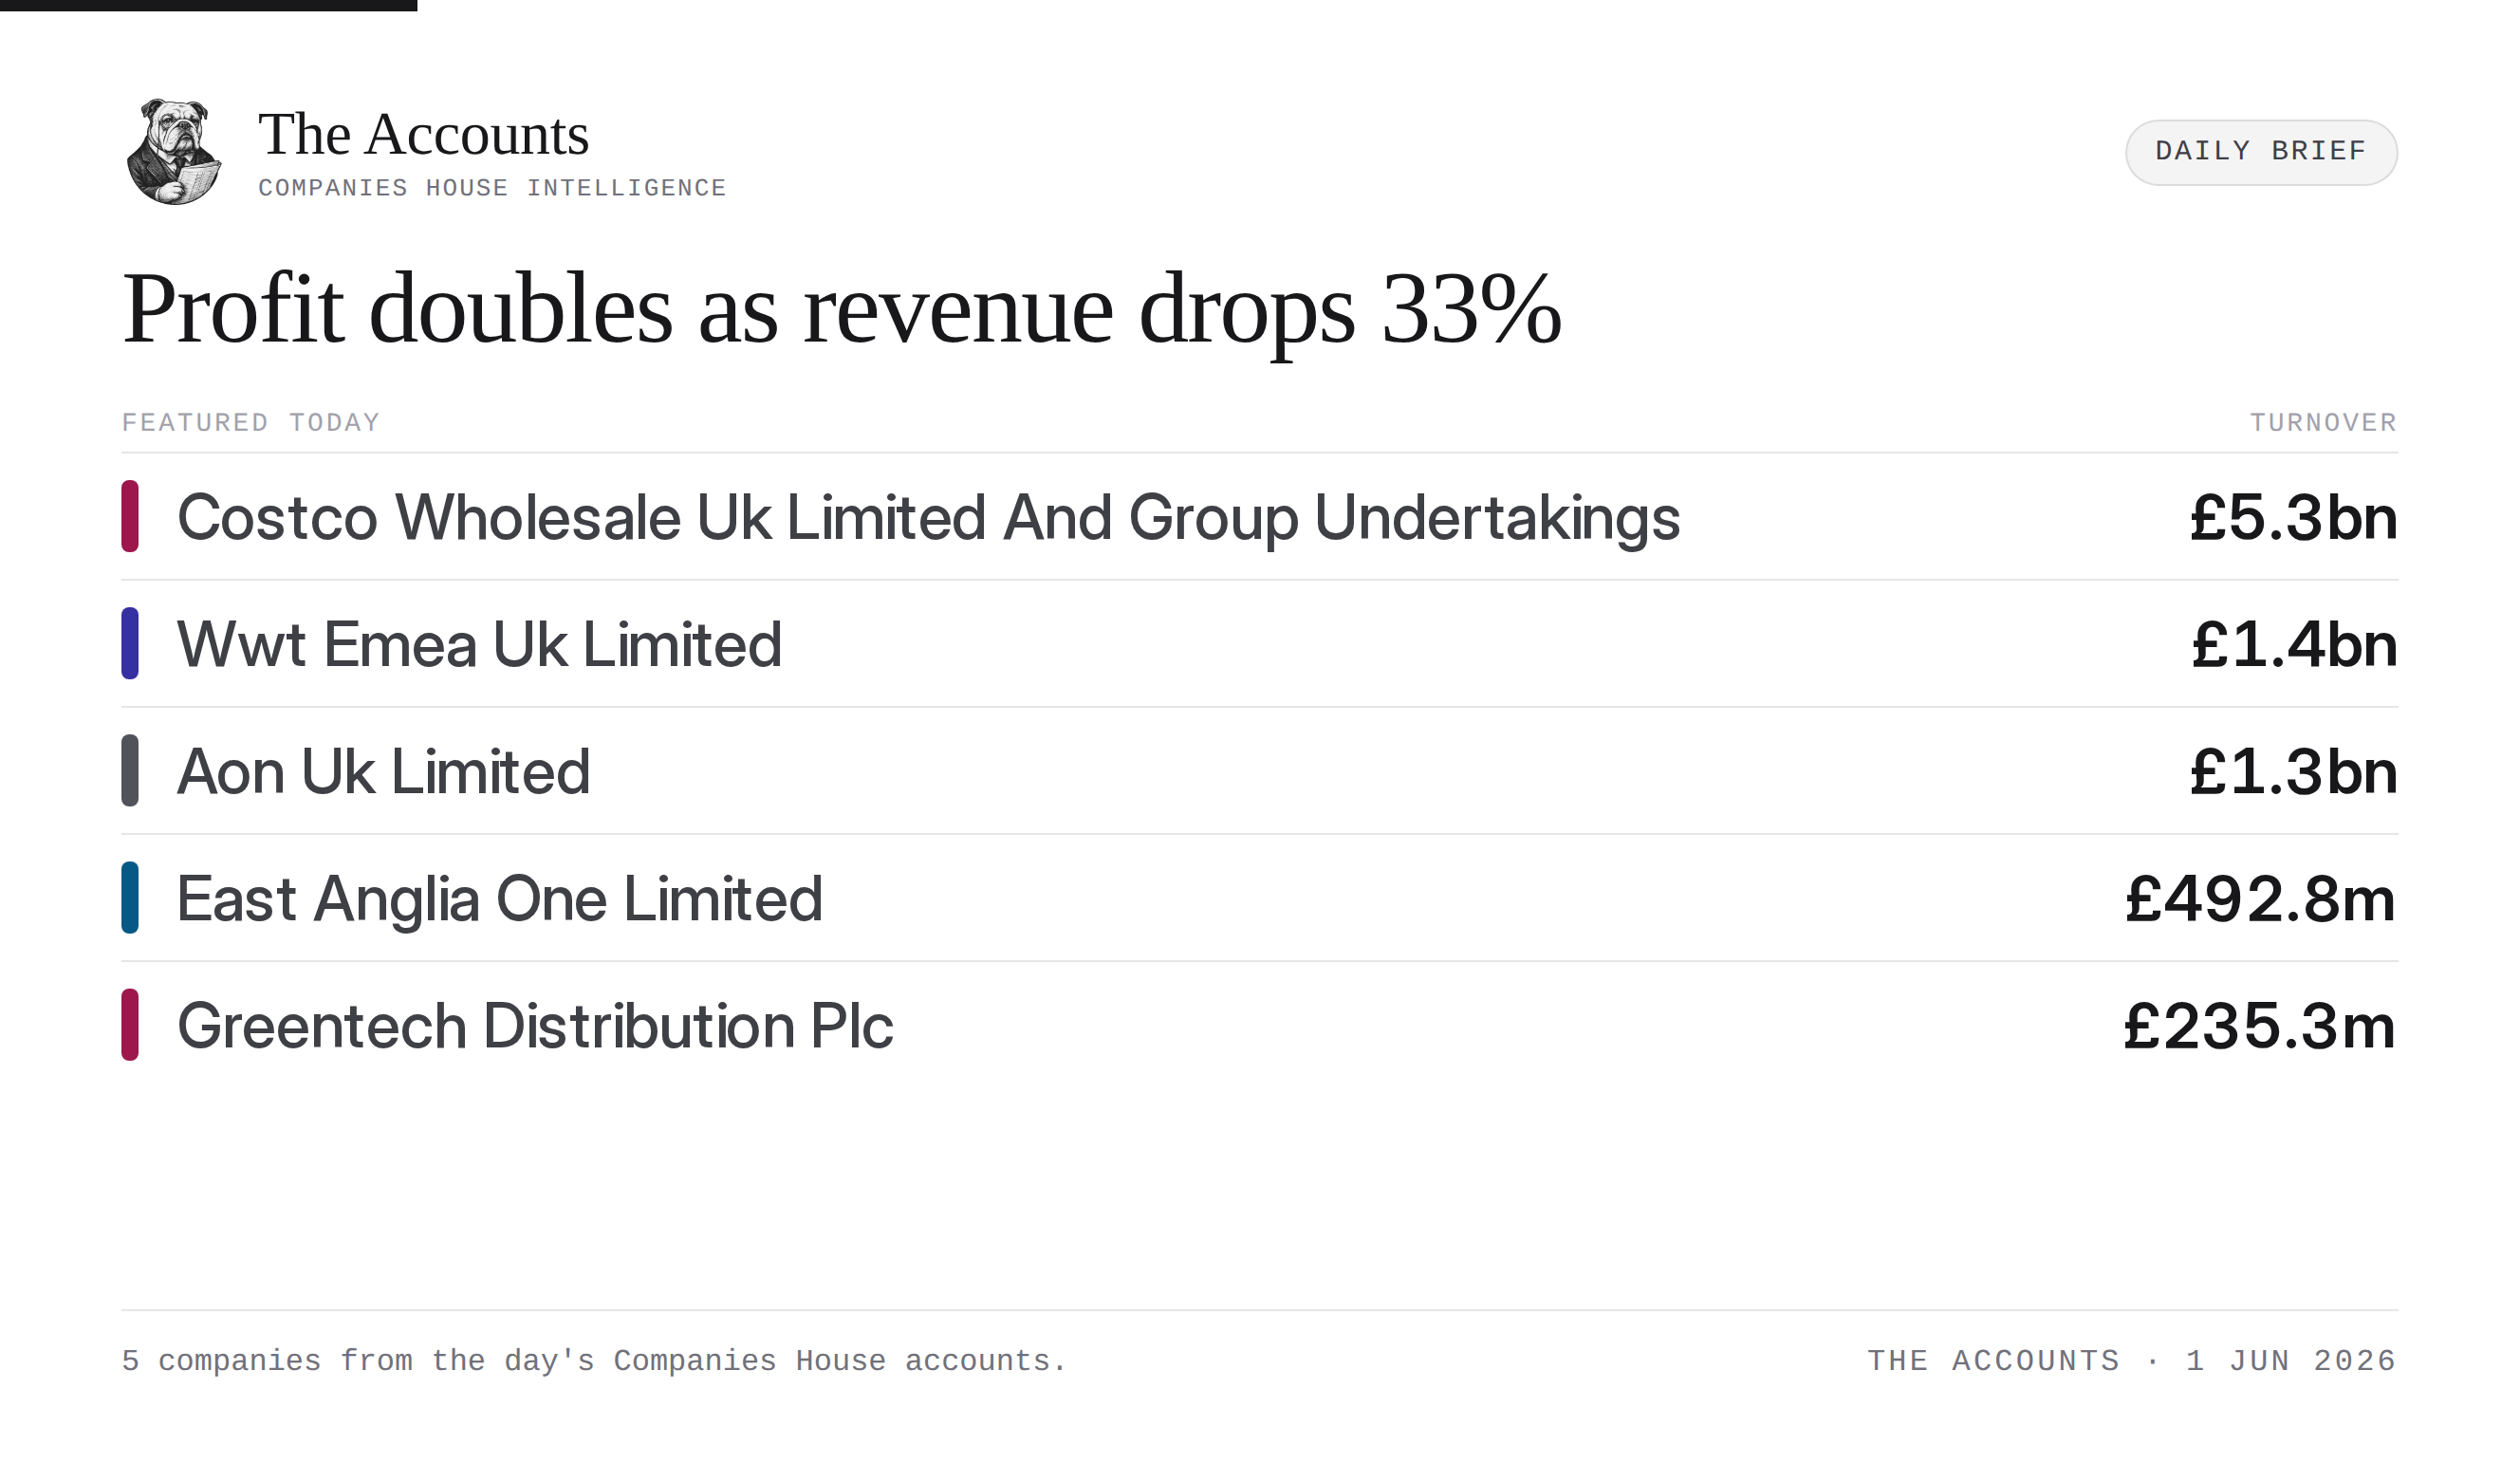
Profit doubles as revenue drops 33%
The takeaways
- WWT EMEA recorded a third less revenue but nearly doubled its net profit, pointing to a shift in revenue mix
- Aon UK saw its top line remain flat, while a halved tax charge coincided with a 21% boost to the bottom line
- Costco's UK arm widened its margins as administrative costs remained flat against growing sales
Costco Wholesale Uk Limited And Group Undertakings [1]
Margin expansion
| Line | FY25 | FY24 | YoY |
|---|---|---|---|
| Profit & loss | |||
| Turnover | £5.3bn | £5.1bn | ▲ +5% |
| Gross profit | £292.5m | £262.8m | ▲ +11% |
| Admin expenses | £86.2m | £87m | ▼ −1% |
| Operating profit | £206.3m | £175.7m | ▲ +17% |
| Finance costs | £654k | £4.5m | ▼ −85% |
| Profit before tax | £217.6m | £187.8m | ▲ +16% |
| Net profit | £164.8m | £150.9m | ▲ +9% |
| Cash & balance sheet | |||
| Net assets | £829.4m | £885.1m | ▼ −6% |
| Dividends paid | £200m | £200m | ▲ −0% |
| People & pay | |||
| Avg. headcount | 8,748 | 8,524 | ▲ +3% |
| Staff cost | £365.2m | £341.8m | ▲ +7% |
The UK arm of the American warehouse club continues to record steady growth. The dynamic here centres on operating leverage: while the top line expanded, administrative expenses shrank by a fraction to £86.2m. This dynamic saw operating profit comfortably outpace sales growth. A steady set of numbers, noting that the accounts for an entity of this scale were filed entirely unaudited.
Wwt Emea Uk Limited [2]
Favourable mix shift
| Line | FY25 | FY24 | YoY |
|---|---|---|---|
| Profit & loss | |||
| Turnover | £1.4bn | £2.1bn | ▼ −34% |
| Gross profit | £298.2m | £181.4m | ▲ +64% |
| Admin expenses | £73.1m | £57m | ▲ +28% |
| Operating profit | £225.1m | £124.3m | ▲ +81% |
| Finance costs | £85.5m | £53.1m | ▲ +61% |
| Profit before tax | £142.6m | £75.3m | ▲ +89% |
| Net profit | £103m | £53.5m | ▲ +93% |
| Cash & balance sheet | |||
| Net assets | £129.5m | £56.5m | ▲ +129% |
| Dividends paid | £30m | £104.8m | ▼ −71% |
| People & pay | |||
| Avg. headcount | 285 | 255 | ▲ +12% |
| Staff cost | £69m | £48.7m | ▲ +42% |
A notable divergence at the regional IT consultancy. Turnover fell by a third, yet gross profit surged 64.4% and the bottom line nearly doubled. This pattern points toward a major mix shift, likely reflecting a move from high-volume hardware sales toward higher-margin services. The period also saw an increase in resources, with average headcount ticking up and the total staff cost climbing 41.6%.
Aon Uk Limited [3]
Tax-rescued profit
| Line | FY25 | FY24 | YoY |
|---|---|---|---|
| Profit & loss | |||
| Turnover | £1.3bn | £1.3bn | ▲ +0% |
| Admin expenses | £199.4m | £178.1m | ▲ +12% |
| Operating profit | £450.7m | £475.9m | ▼ −5% |
| Finance costs | £130k | £1.9m | ▼ −93% |
| Profit before tax | £516.5m | £524.4m | ▼ −2% |
| Net profit | £450.8m | £370.6m | ▲ +22% |
| Cash & balance sheet | |||
| Cash | £1.6bn | £1.6bn | ▲ +1% |
| Net assets | £1.4bn | £1.3bn | ▲ +10% |
| Dividends paid | £336.9m | £215.4m | ▲ +56% |
| People & pay | |||
| Avg. headcount | 4,363 | 4,367 | ▼ −0% |
| Staff cost | £607.1m | £601.4m | ▲ +1% |
| Director pay | £5.9m | £5.9m | ▼ −1% |
| Highest-paid director | £1.8m | £1.4m | ▲ +35% |
The insurance broker’s top line barely moved this year. Core trading contracted slightly, with operating profit slipping as administrative expenses climbed 12% to £199.4m. But the bottom line tells a different story entirely: a significantly lighter tax charge—falling from £153.8m to £65.7m—altered the final picture, coinciding with a 21.6% jump in net profit. That final result was accompanied by a £336.9m dividend back to the parent.
East Anglia One Limited [4]
High-margin infrastructure
| Line | FY25 | FY24 | YoY |
|---|---|---|---|
| Profit & loss | |||
| Turnover | £492.8m | £405.3m | ▲ +22% |
| Gross profit | £441.7m | £355.5m | ▲ +24% |
| Operating profit | £290.3m | £262.9m | ▲ +10% |
| Finance costs | £7.7m | £6.5m | ▲ +18% |
| Profit before tax | £286.4m | £261.2m | ▲ +10% |
| Net profit | £212.8m | £193.8m | ▲ +10% |
| Cash & balance sheet | |||
| Cash | £110.9m | £63.2m | ▲ +75% |
| Net assets | £1.2bn | £1.3bn | ▼ −6% |
| Dividends paid | £290.3m | £300m | ▼ −3% |
A pure infrastructure play doing exactly what it says on the tin. The Iberdrola-backed offshore wind farm recorded a steady period, with turnover rising 21.6%. With no payroll costs recorded, that top-line growth translated directly down the P&L to lift operating profit. The resulting 59% operating margin is the sort you can happily nap on.
Greentech Distribution Plc [5]
Squeezed by admin
| Line | FY26 | FY25 | YoY |
|---|---|---|---|
| Profit & loss | |||
| Turnover | £235.3m | £263.2m | ▼ −11% |
| Gross profit | £8.2m | £5.7m | ▲ +44% |
| Admin expenses | £5.2m | £2.8m | ▲ +84% |
| Operating profit | £1.8m | £2.1m | ▼ −14% |
| Finance costs | £73,406 | £78,271 | ▼ −6% |
| Profit before tax | £1.9m | £2.3m | ▼ −17% |
| Net profit | £1.4m | £1.7m | ▼ −18% |
| Cash & balance sheet | |||
| Dividends paid | £50,000 | £1.3m | ▼ −96% |
| People & pay | |||
| Avg. headcount | 18 | 19 | ▼ −5% |
| Staff cost | £2.2m | £1.8m | ▲ +27% |
| Director pay | £190k | £186k | ▲ +2% |
A complex set of numbers for the telecoms recycler. Like WWT, the top line contracted while gross profit expanded, jumping 43.9% to £8.2m. However, the cost base expanded elsewhere. Administrative expenses nearly doubled to £5.2m, completely offsetting the gross margin gains and pushing operating profit down. The notes record a significant volume of related-party trading, with £26.7m in purchases and £18.5m in sales conducted with companies under common control.
Proof today that the biggest number on the P&L isn't always the most important. I'll take a wider margin over top-line volume any day of the week.
Sources
- Costco Wholesale Uk Limited And Group Undertakings
- Wwt Emea Uk Limited
- Aon Uk Limited
- East Anglia One Limited
- Greentech Distribution Plc